Actionable Guide to Measuring Your SEO Strategy

Measuring the impact of your SEO strategy is absolutely crucial. Let’s explore analytics and the data analysis tools every website should be using.
Measuring your SEO success
It’s all well and good transforming your SEO strategy and implementing various techniques to help you fly up the rankings but if you aren’t tracking your results how will you ever know what’s working and what’s not?
Keeping track of your data and analytics will give you essential knowledge on key areas, which will help you keep improving your SEO strategy. Key questions you can find the answers to with the help of your website analytics include:
- How many visitors is my website getting?
- What country/region are my visitors from?
- What is my click-through rate?
- What is my bounce rate?
- What keywords is my website ranking for?
- How do users interact and navigate my website?
When you measure your SEO success, you need to have an end goal in mind, which is why it's always a good idea to set yourself short-term and long-term goals that you'd like to hit. Think about what you'd like your website to achieve and how this aligns with your broader business strategy and plans. Make sure your goals and objectives are specific and can be measured accurately.
Some of the key metrics you can measure which will help you to understand what's working and how you can improve include:
Keyword ranking - One of the key metrics to keep your eye on is the search position for your target keywords. Search results can change daily, so checking regularly will help to give you a good idea of how your website is performing.
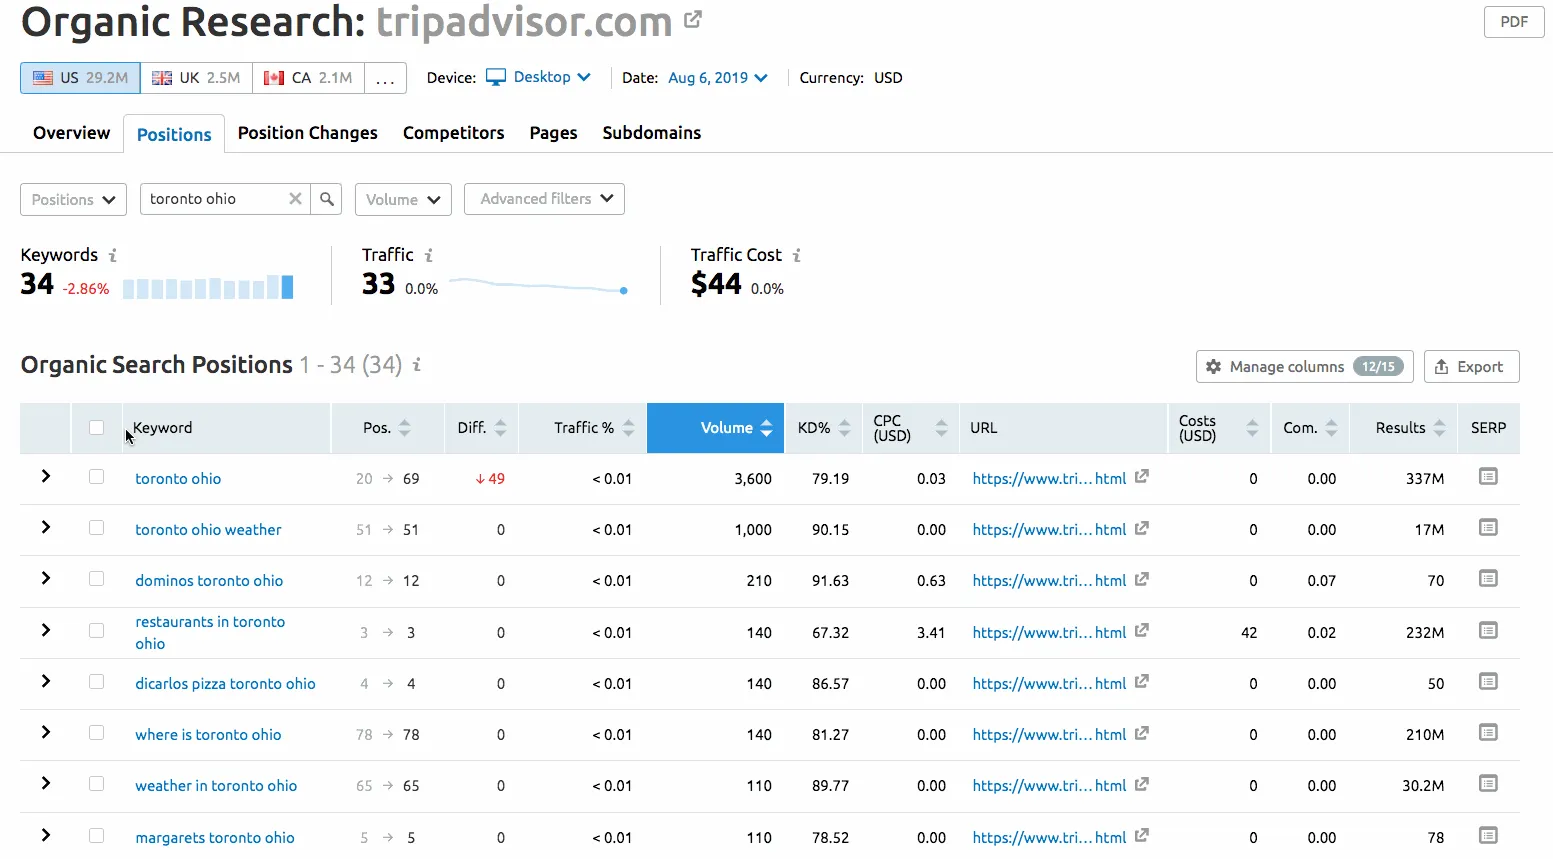
Click-through-rate - It's all well and good ranking well for a search term, but you need users to select your result and click through to your website. Keep a close eye on your click-through rate as well as which search terms are providing you with the most clicks. This can help to inform your future targeting.
Conversion rate - Your conversion rate refers to how many times a user has actively converted on your website. A conversion can be anything from making a purchase, downloading a guide or signing up to your newsletter; it all depends on your goal.
Conversion rate is calculated by simply dividing the number of conversions by the number of unique visits to give you a percentage. Understanding your conversion rate can help you predict the ROI that your website and SEO strategy will deliver.
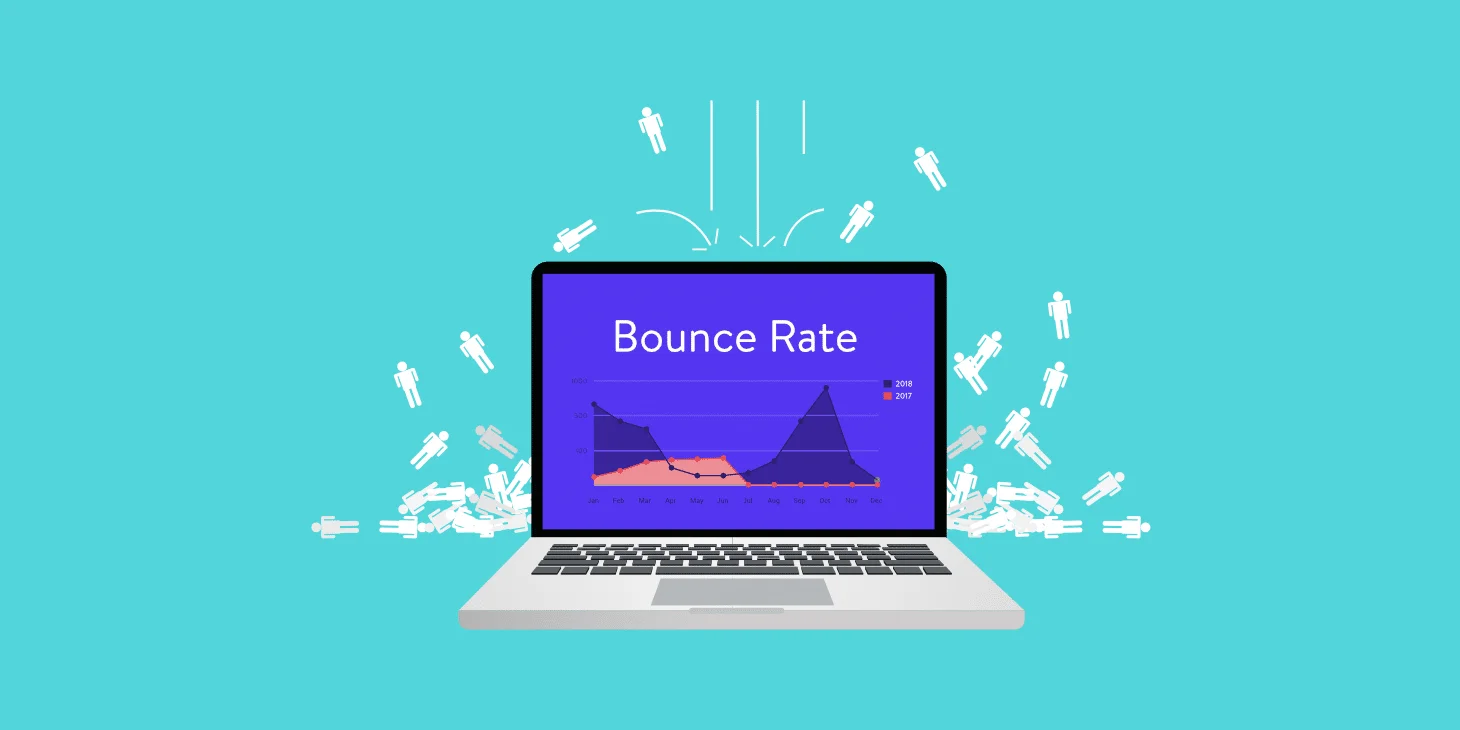
Bounce rate - A bounced session is where a user will leave your website without taking action or exploring it further. Google certainly takes bounce rate into account when ranking websites, so it's a good idea to try and keep yours down. Remember, though, it all depends on what content you're providing. For example, if you're a pub, users may click on your website to find your opening times and then leave with the information they were looking for, meaning a bounced session isn't always a bad thing.
Time on page - Another metric you can use to help understand how your website performs is the time a user spends on a page. If users spend only 30 seconds on a piece of 3000-word cornerstone content, then that suggests you've got a problem. When analysing your time-on-page data, consider the intent of each page. For example, a user will spend much less time on a contact page than on a blog post.
Pages per visit - Pages per visit can be a valuable metric, especially if your goal is to direct users to other content and web pages within your website. Usually, you can presume that the more pages a user visits then, the better their experience as they stay on your website and not leave for another one.
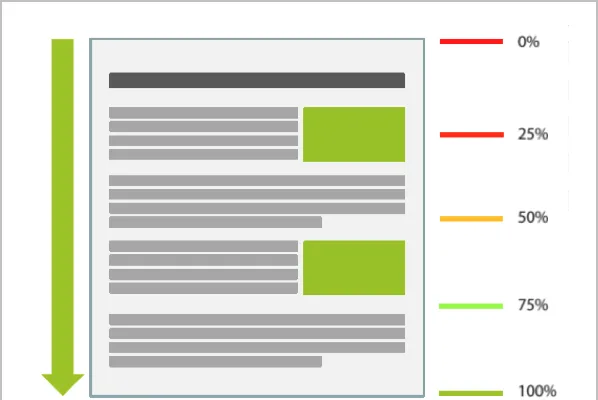
Scroll depth - Scroll depth refers to how far a user scrolls down a web page and can help you ensure you're formatting your content in the best possible way. If you're placing important information at the bottom of your page and users aren't scrolling down to see it, then you can determine that you need to make some changes to how you're presenting your content. Similarly, think about why users aren't scrolling down. Are they getting all the information they need from half the page meaning the rest of your content is unnecessary?
Exit pages - An exit page is the page a user lands on before exiting your site. Knowing which pages directly lead to users leaving your website will allow you to uncover if you need to make any changes to the content on these pages. Whilst a high exit page rate may mean the page is poor and putting users off; it's important to remember that a user can't stay on your site forever, and once they've got the information they're looking for, they're always going to leave.
When it comes to measuring your analytics, there are three key tools that every website should be using:
- Google Search Console
- Google Analytics
- Rank Tracking tools
Google Search Console
Google Search Console is a set of free tools that Google offers webmasters to track how well their website is performing in Google's search results and what they can do to improve their rankings.
Not only does Google Search Console offer you the ability to monitor how your website is performing and spot any issues, but you'll also receive email notifications every time the tools notice a new error on your website, allowing you to fix it fast without having to be constantly checking the dashboard.
To get started with Google Search Console, you'll need to create an account, add your website and verify that you're the owner. Once you're all set up and verified, Google Search Console will provide you with multiple different dashboards which will present you with detailed information on various aspects of your website's performance.
The main dashboard that you will use to monitor your website's performance is the performance report...wow, who would have thought it?!
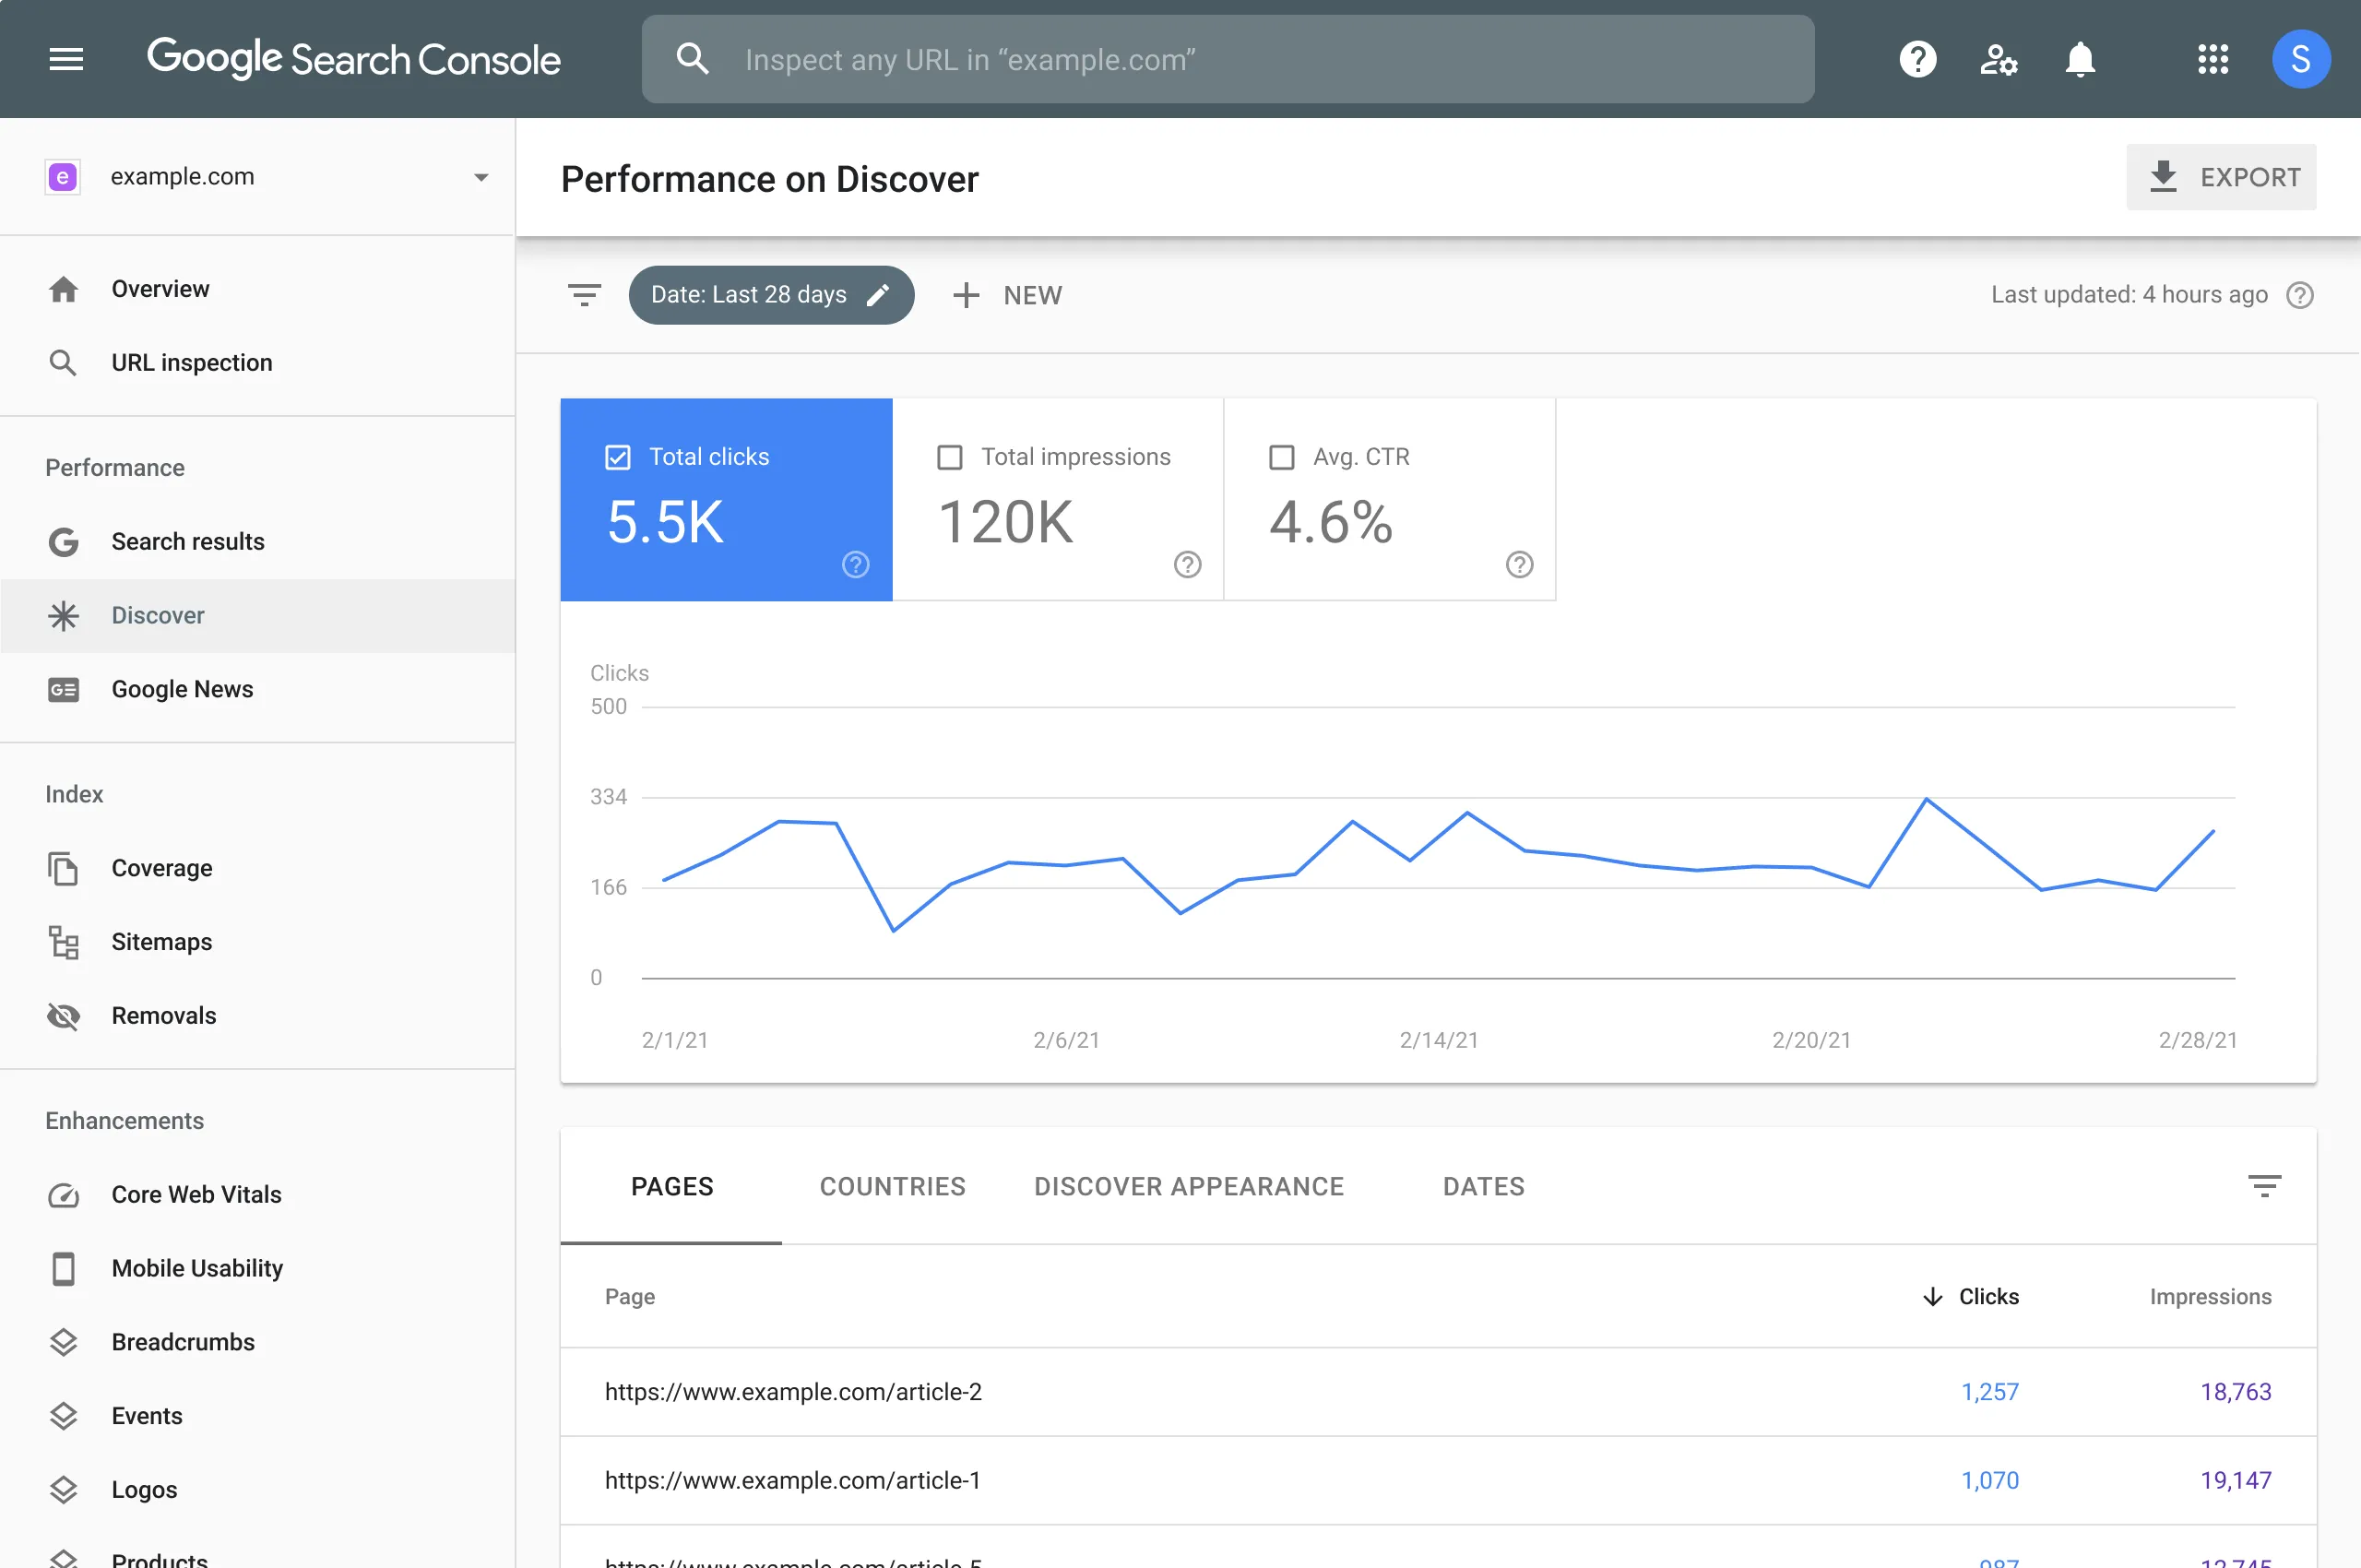
The performance report will give you in-depth information about how your website and individual web pages are performing in Google’s search results. Here you’ll be able to see which keywords you’re ranking for and where you’re sitting within the search results. You’ll also have access to historic data for up to 16 months allowing you to easily track and compare your progress.
The Top Filter within the performance dashboard allows you to filter down your data via categories such as date and search type e.g. mobile. The four main metrics that Google Search Consoles performance report will present to you are:
- Clicks
- Impressions
- Average click-through-rate
- Average ranking position
Not only is your performance report incredibly useful for the top level insights above, you can also use it to gain deeper insight to help really boost your search performance.
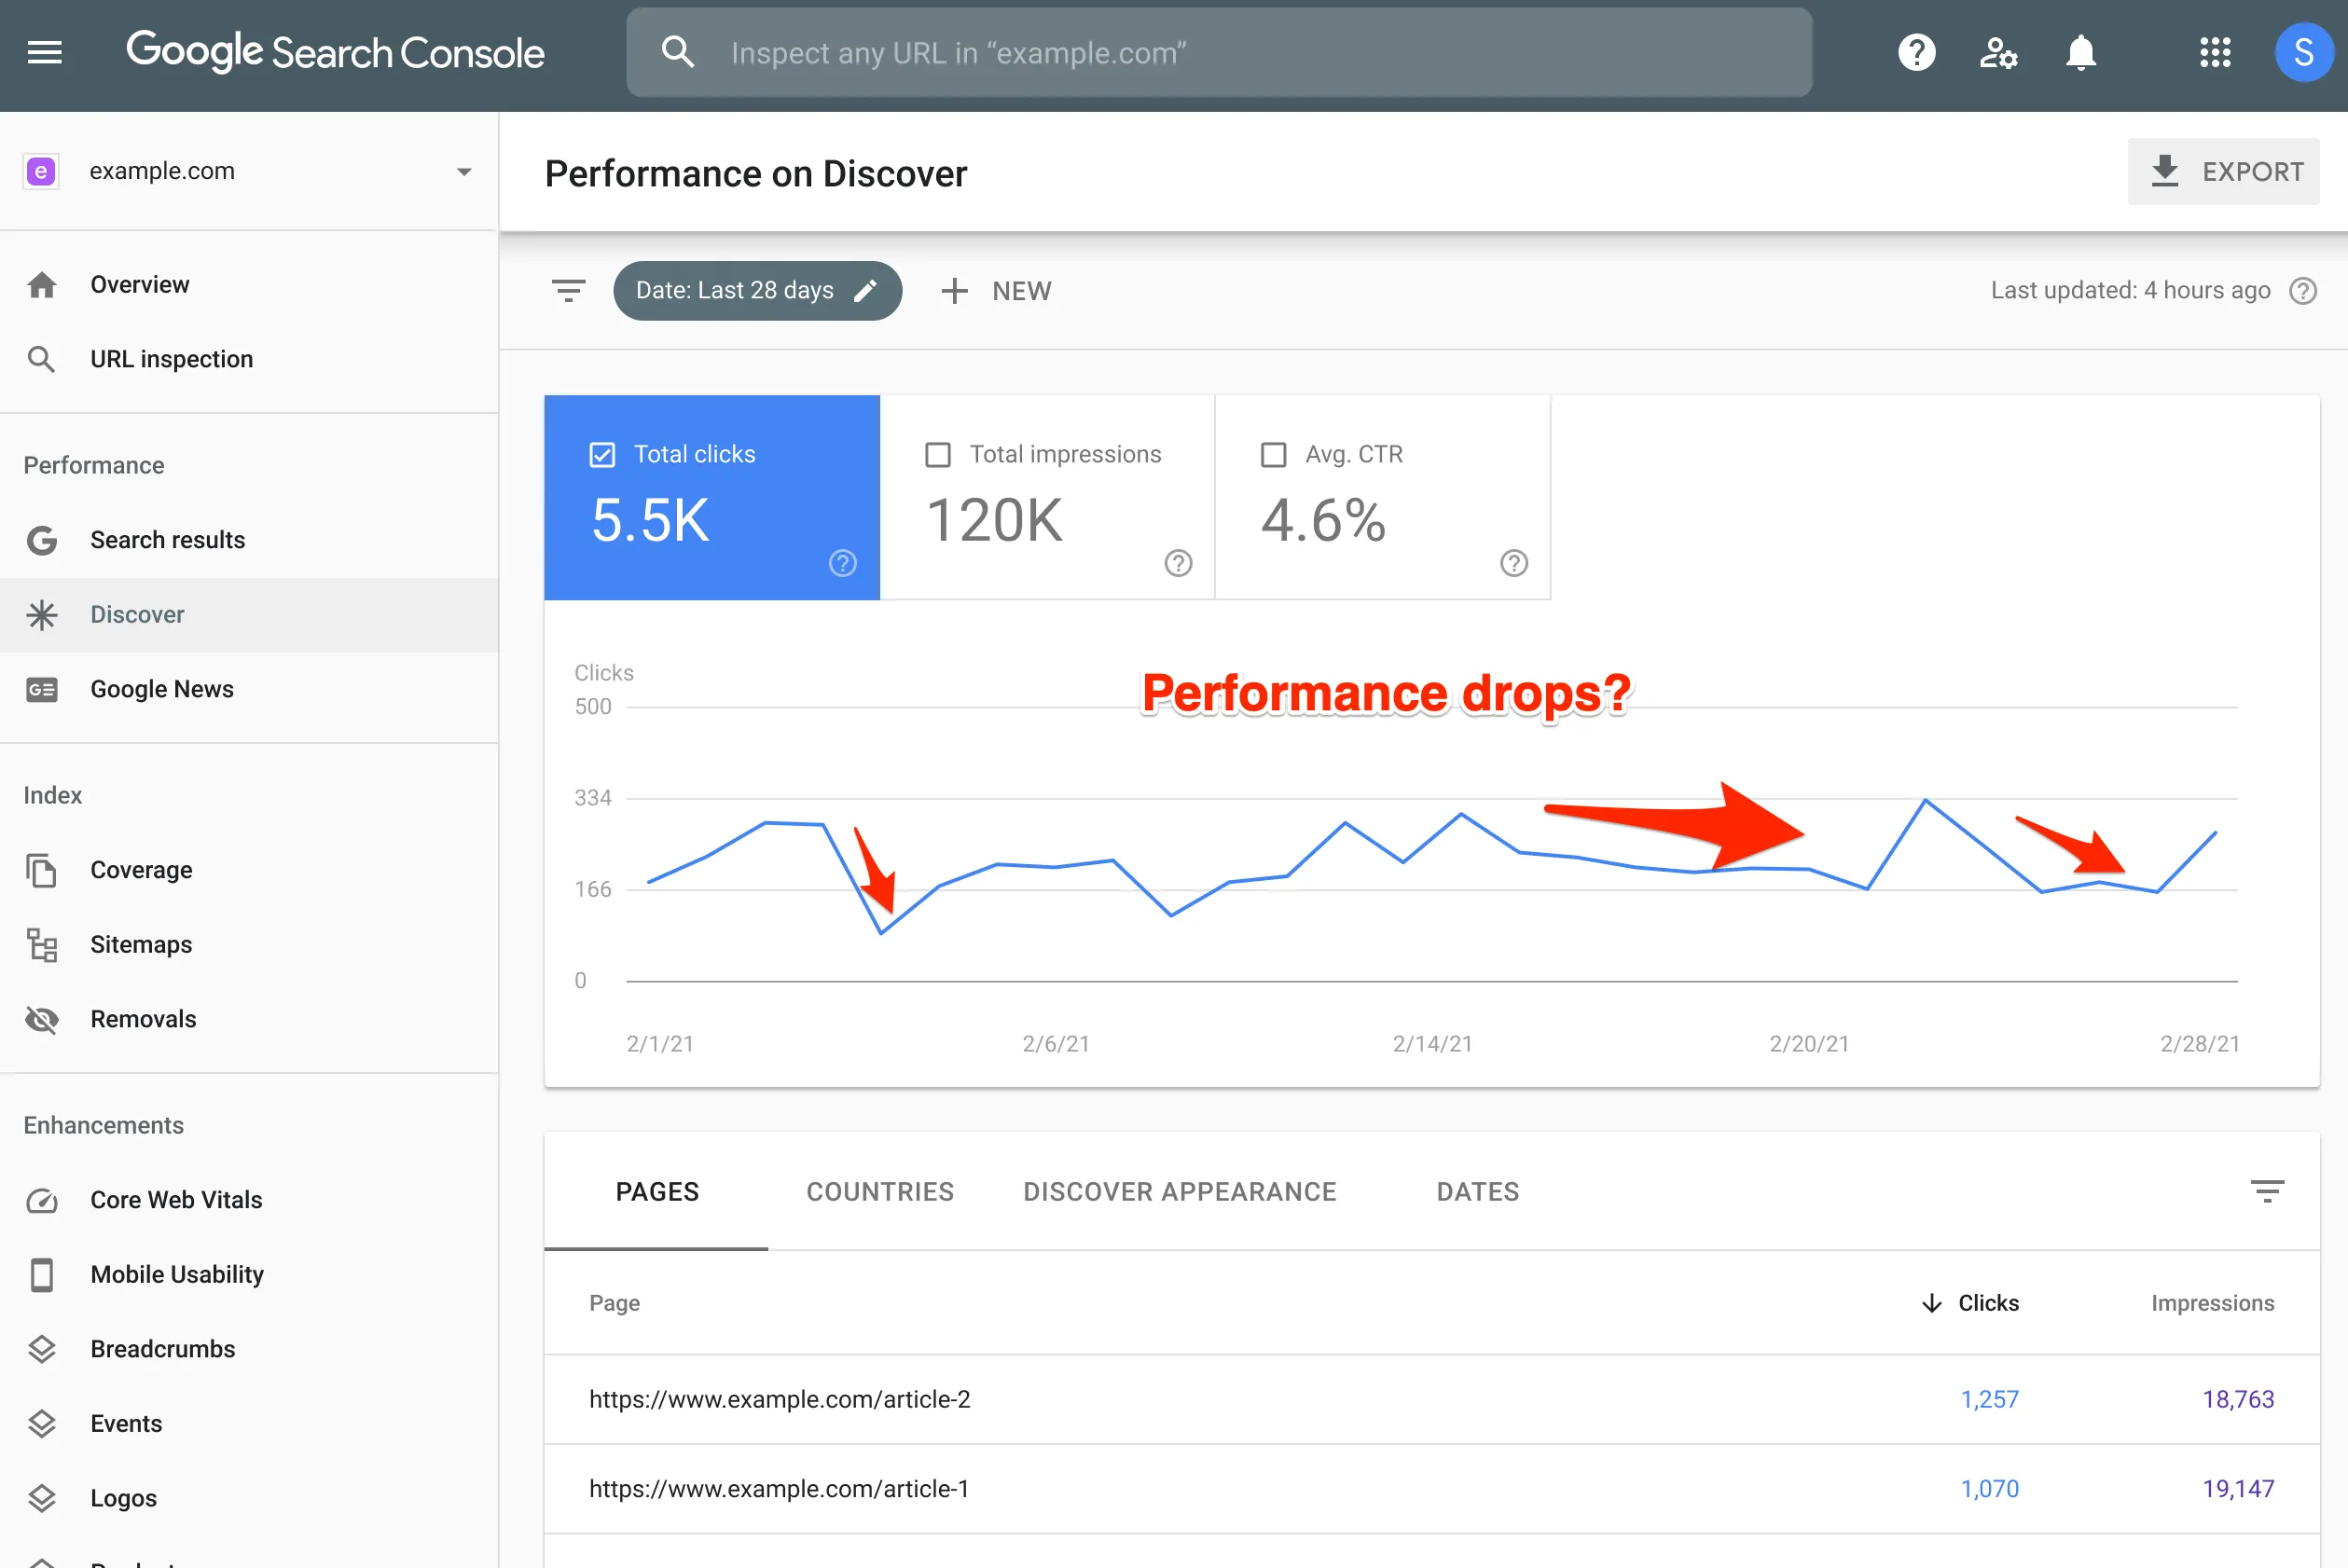
Analyse performance drops - When you notice a drop in your performance you can use the search console to uncover the root of the problem. Perhaps you’ve dropped in the rankings for a certain search term or your website isn’t loading on mobile, whatever it is you can find it and sort it pronto!
Click-through-rate optimisation - You can use Google Search Console to cross-reference web pages that are ranking well for your target keywords but that have a low click-through-rate. Perhaps you need to revisit your title tag and meta description for these pages in order to help convince users to click through to your website.
Compare mobile vs desktop performance - By using the dashboards compare option you’ll be able to directly compare how you perform on mobile devices compared to desktop. Remember that Google uses the mobile version of your website to rank you but that doesn’t mean you should forget all about the performance and user experience of your desktop site.
Compare branded and non-branded searches - A handy feature within the performance report is being able to filter your results to “queries containing” allowing you to see how well you’re performing for branded searches. If you think you’re under-performing for searches featuring your brand name you can take steps to optimise your website.
Other dashboards Google Search Console offers include:
- URL Inspection - Provides information on all of the versions of your web pages that have been indexed by Google.
- Links - An overview of both internal and external links that point to your website.
- Sitemaps - Here you can add new sitemaps and see all of the old versions you have previously uploaded.
- Security Issues - This will flag up any potential security issues with your website.
- Manual Actions - Here you will find out if you have any manual penalties from Google.
Google Analytics
Google Analytics is another free tool that Google provides in order to help website owners understand how they’re performing. Google Analytics provides a lot of data and reports so it can be a little overwhelming when you first get started. In order to make use of Google Analytics you’ll need to insert a specific piece of code on your website.
Google Analytics provides various different reports that are organised into five different categories:
- Real-time - the activity of a user as it happens in real-time.
- Audience - This will tell you everything you could possibly need to know about your audience such as age and gender demographics, location, devices and wider interests.
- Conversions - How your visitors are converting and the number that are.
- Behaviour - How your visitors navigate and engage with your website.
- Acquisitions - Where your traffic is coming from such as social media platforms, referrals or search results.
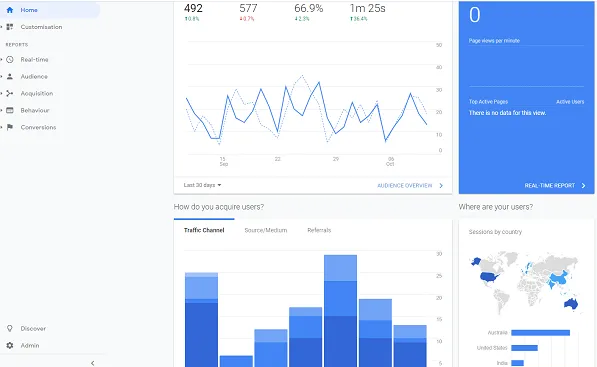
When analysing the data that Google Analytics provides you with you can filter it down using metrics such as date range, device, and organic or paid referrals.
Whilst Google Analytics provides a lot of in-depth data, many website owners looking to improve their SEO strategy and results will only need to make use of a few basic reports in order to get the most out of the tool. Some of the basic information you can find out that could help to transform your online presence includes:
Audience demographics - Google Analytics will provide you with extensive information about your audience such as their age, gender, likes and dislikes, location and searching device, all of which you can use to help ensure you’re providing them with the content they’re looking for.
Traffic sources - Understanding where your traffic comes from is key if you want to get a full picture of how your website is performing. Google Analytics allows you to see where your top referrals are coming from and how people are finding your content.
Most visited pages - Discover which web pages are your most popular and which ones are receiving the least traffic and that may require further optimisation.
First visited page - This report will highlight which pages are the ones that users are landing on first, whether it’s from search results or other referrers.
When comparing how different pages are performing, always try to use similar pages. For example if you are comparing the bounce rate of a page make sure to compare one blog post to another or one product page to another for the most accurate results.
Rank tracking tools
Rank tracking tools, such as those provided by SEMrush or Ahrefs, will monitor how your website is performing in search engines for specific keywords and are often considerably easier to use than both Google Analytics and Google Search Console due to the reduced amount of data on offer.
Using a rank tracking tool can have many benefits to your SEO strategy such as:
- Daily updates on your ranking positions.
- Track your progress in specific locations.
- Quickly notice any drop in rankings.
- Track your competitors in order to compare your ranking progress.
Remember your SEO progress will likely differ from day to day so unless you’ve drastically plummeted in the rankings or received a penalty from Google then slight fluctuation shouldn’t be too much of a cause for concern. When analysing your data always do so with context in mind and compare like-for-like metrics and pages and you’ll be able to successfully use your analytics to inform your SEO strategy moving forward.



Comments